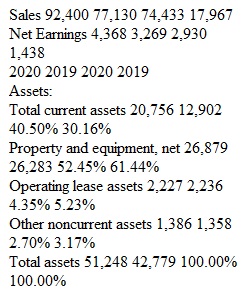
Q Description Financial Statement Case Assignments are a collection of individual assignments whose total point value equals 160. Please read the General Information and Instructions for the Financial Statement Case Assignments carefully before starting. Make sure you know how the fiscal year for Target Corporation is presented by watching this video. Financial Statement Case 17-1 Requirements - Please note for this assignment you must use spreadsheet software (Excel, Google Sheets, etc) 1. Compute trend analyses for Sales and Net earnings / (loss). Use 2018 as the base year. What is the most notable aspect of these data? 2. Perform a vertical analysis for Target Corporation’s balance sheet as of January 30, 2021 (fiscal year 2020), and February 1, 2020 (fiscal year 2019). Include only these main categories: Assets: ?Total current assets ?Property and equipment, net Operating lease assets ?Other noncurrent assets ?Total assets Liabilities and shareholders’ investment: ?Total current liabilities ?Total noncurrent liabilities ?Total shareholders’ investment ?Total liabilities and shareholders’ investment Rubric Financial Statement Case 17-1 Rubric Financial Statement Case 17-1 Rubric Criteria Ratings Pts This criterion is linked to a Learning OutcomeQuestion 1 12 pts Full Points Trend analysis computed correctly, notable aspects described, Excel execution thorough. 8 pts Partial points Minor computation errors, notable trends not explained in detail, minor Excel mistakes. 6 pts Half Points Trend analysis and key points missing some details. Excel presentation contains a few errors. 0 pts No Points Both parts of question answered incorrectly. 12 pts This criterion is linked to a Learning OutcomeQuestion 2 12 pts Full Points Vertical analysis completed without error 8 pts Partial points Vertical analyses completed with 25% errors 6 pts Half points Vertical analyses completed with 50% errors 0 pts No points Answer is incorrect 12 pts Total Points: 24 PreviousNext
View Related Questions